Beyond Google Analytics: How I Use Microsoft Clarity to Fix UX and Skyrocket
• Zahid Ul Islam
Google Analytics tells you what is happening on your website, but it fails to tell you why. In this guide, I break down how I use Microsoft Clarity’s heatmaps, session recordings, and "rage click" detection to visualize user frustration and turn lost traffic into revenue.
As a frontend engineer and CRO specialist, I live by one rule: Data beats opinion.
We spend hours debating button colors, layout changes, and copy tweaks. But once a site goes live, most businesses rely entirely on Google Analytics (GA4) to judge performance. While GA4 is incredible for tracking traffic sources and conversion events, it has a massive blind spot.
It tells you that 98% of your visitors didn't buy. But it doesn't tell you why.
Did they get confused? Did a button fail to load? Did they get annoyed by a popup and leave?
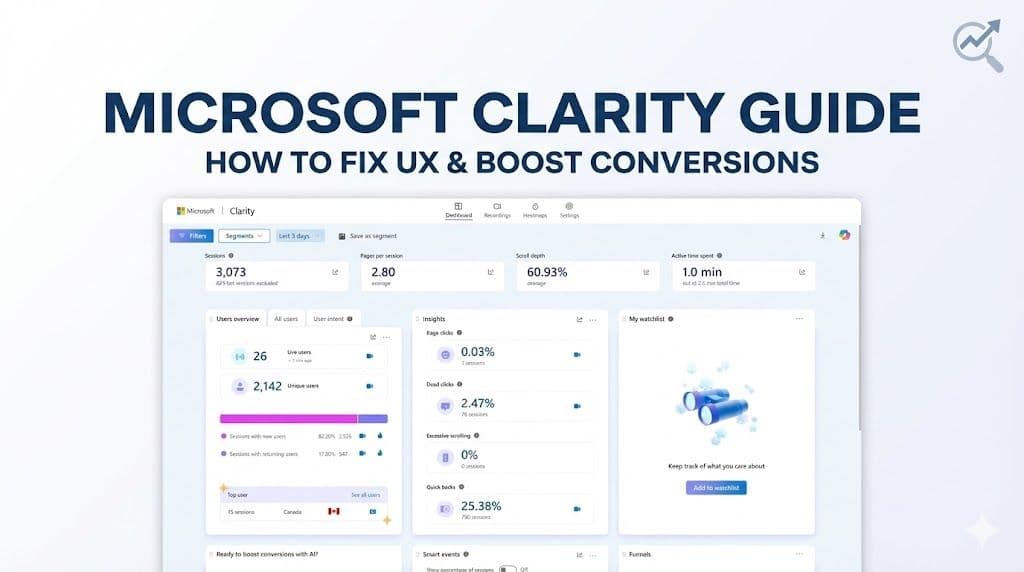
To answer the "why," I use Microsoft Clarity. It is, hands down, the most powerful free behavioral analytics tool available today. Here is a deep dive into how I use it to audit Shopify stores and web apps to uncover hidden revenue.
Why Microsoft Clarity Over Hotjar?
For years, Hotjar was the industry standard. But for most small-to-medium businesses, the pricing model is restrictive.
- Hotjar (Free Tier): Strictly limited daily sessions. You miss critical data.
- Microsoft Clarity: Free forever. No traffic limits. No sampling.
Whether you have 100 visitors or 100,000, Clarity captures everything. For my clients, this is a no-brainer.

The 3 Pillars of Behavioral Analytics
When I audit a website, I look at three specific data points in Clarity to find "leaks" in the conversion funnel.
1. Heatmaps: Visualizing Attention
Heatmaps aggregate all user interactions into a color-coded overlay.
- Click Maps: These show what users are actually clicking. I often find users clicking on unlinked text or images, expecting a result. These are missed opportunities to link to products.
- Scroll Maps: This is vital for mobile optimization. If your "Add to Cart" button is below the fold, and the scroll map shows only 50% of users reach that point, you have a layout problem. Move the CTA up, and conversions usually follow.
- Area Maps: Perfect for Shopify collection pages. It tells you exactly which product cards get the most engagement and which are being ignored.
2. Session Recordings: The "Over-the-Shoulder" View
This is as close as you can get to sitting next to your customer. Recordings let me watch individual user journeys (anonymized for privacy).
I look for hesitation. If a user fills out a checkout form, stops, highlights the shipping cost, deletes an item, and leaves—that is a pricing objection. If they click "Checkout" and nothing happens, that is a Javascript error. You can’t spot these specific friction points in a spreadsheet.
3. Frustration Metrics (The Money Savers)
Clarity automatically tags sessions where users struggled. This is where I start every audit:
- Rage Clicks: When a user rapidly clicks the same area multiple times. This usually means a broken button or a slow-loading element.
- Dead Clicks: When a user clicks something that looks interactive but isn't.
- Excessive Scrolling: Indicates the user is lost and can't find what they are looking for.
How I Use This Data to Increase Conversions
When I work with clients, I don't just send a report of problems; I implement fixes based on this data.
Case A: The "Fake" Button I noticed a high "Dead Click" rate on a specific icon in a client's features section. Users thought it was a link to a demo. We made it a clickable link, and engagement on the demo page increased by 20%.
Case B: The Mobile Drop-off On a Shopify store, the Scroll Map revealed that only 35% of mobile users were scrolling down to the customer reviews. Since social proof is a huge conversion factor, we moved a snippet of the reviews to the top of the product page. The bounce rate dropped significantly.
Performance and Privacy
As a developer, I am always wary of third-party scripts slowing down a site. Microsoft Clarity is asynchronous, meaning it doesn't block your site from loading. It’s also GDPR and CCPA compliant by default, automatically masking sensitive text (like names and credit card numbers) so you don't have to worry about user privacy.
Stop Guessing, Start converting
If you aren't using behavioral analytics, you are essentially running your store in the dark. You might have the best product in the world, but if your UX is blocking users from buying, you are leaving money on the table.
Install Clarity today. The insights you find in the first 24 hours will surprise you.
Need Help Analyzing Your Data?
Tools are only as good as the strategy behind them. Installing Clarity is the easy part; interpreting the data to make profitable design changes is where the real work happens.
If you want to stop guessing and start converting, I can help. I audit Shopify stores and custom web apps to identify exactly where you are losing customers and how to fix it.
📅 Let's discuss your project: Book a meeting with me